Rice Productivity Analysis in India
Rice Productivity Analysis in India |
| Introduction |
Rice is the most important cereal food crop of India. It occupies about 23.3% of gross cropped area of the country. It plays vital role in the national food grain supply. Rice contributes 43% of total food grain production and 46% of the total cereal production of the country. Rice is the staple food of more than 60% of the world's population especially for most of the people of South-East Asia. Among the rice growing countries in the world, India has the largest area under rice crop and ranks second in production next to China.
The productivity of rice in India is higher than Thailand, Pakistan, Bangladesh and Nepal but much below the productivity in Japan, China, Korea, U.S.A. and Indonesia. Average rice productivity in India during 1999-2000 was 1986 kg/ha, which is about 23% below the world average productivity of 2563 kg/ha during the same year.
There is considerable increase in productivity of rice in India during the recent past. The productivity of rice which was 668 kg/ha in 1950-51 has reached to 2,066 kg/ha during 2001-02. The increase in productivity of Rice is about 209% and this increase is due to introduction of high yielding rice varieties responsive to high dose of fertilizers coupled with improved package of practices evolved by Agricultural Scientists for various regions. In fact, there is considerable increase in productivity of rice in the country but there are still certain areas, where rice productivity is low and very low. Rice productivity in such areas fluctuates significantly from region to region due to various factors such as soil type, soil fertility, rainfall pattern, flood, water logging, climatic conditions etc.
These are various factors, which affect the rice crop resulting in low productivity. Therefore, an attempt has been made in this analysis to determine a particular factor /factors responsible for low productivity of rice in certain area. In this process area, production and yield/productivity data for the year 1998-99, 1999-2000 and 2000-01 has been pooled together to arrive at triennium average of area, production and productivity per hectare. In the analysis triennium average data as mentioned above has been used.
In the process of analysis, first the productivity has been classified into various groups and then various rice growing zones have been identified along with States/Union-Territories falling in a particular zone and their percentage share in area and production of rice in the country. The productivity/yield of each zone has also been worked out for the purpose of analysis. Thus, analysis has been further carried out State-wise and District-wise for all rice growing areas. Reasons for low productivity have also been determined with the possible suggestions to improve the productivity of rice in different rice growing eco-systems of the country.
Rice production in India has increased during the last 51 years by nearly 441% or 4.4 times from 20.58 million tonnes in 1950 to nearly 91.05 million tonnes during 2001-02. The status paper is expected to serve as a reference document for agricultural scientists and workers, planners, traders, govt. organizations and other related departments.
|
Rice is grown under varying eco-system on a variety of soils under varying climatic and hydrological conditions ranging from waterlogged and poorly drained situations. Besides, rice is also grown under rainfed and irrigated conditions. Therefore, based on the productivity levels of rice, where it is grown under different eco-systems and climatic conditions, productivity status has been classified into the following groups for the purpose of analysis :
- High Productivity Group ( Yield > 2500 kg/ha )
- Medium Productivity Group ( Yield 2000-2500 kg/ha )
- Medium-Low Productivity Group ( Yield 1500-2000 kg/ha )
- Low Productivity Group ( Yield 1000-1500 kg/ha )
- Very Low Productivity Group ( Yield < 1000 kg/ha )
Detailed explanation of these productivity groups has been provided below.
High Productivity Group
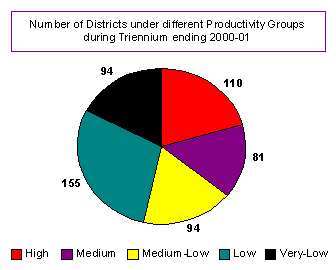
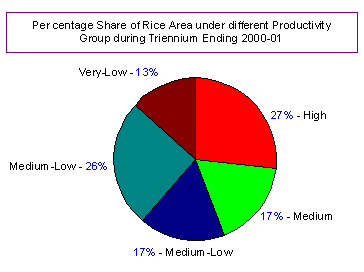
Rice is grown in 534 districts in the country spread over 30 States and Union Territories. The area, Production and Productivity of all rice growing districts in the country from 1998-99 to 2000-01 have been pooled together to arrive at triennium average. In this analysis the triennium average in respect of area, production and productivity have been used. Under high productivity group 110 districts are falling and the productivity of these districts is more than 2,500 kg/ha. The total area of rice in 110 districts, under high productivity group during the triennium ending 2001 was 12.06 million ha, which was 26.9% of total area under rice in the country.
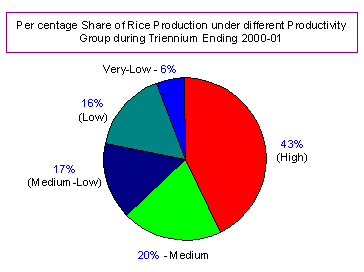
Thus, rice area under high productivity group in the country constitute major share as compared to other productivity groups. Triennium average production of rice was 37.42 million tonnes in 110 districts falling under high productivity group, which was 42.8% of all India total production of rice. The Districts falling under the high productivity group accounts for the major production as compared to other productivity groups. In fact , the average yield per unit area of high productivity districts during the triennium ending 2001 has been worked out to 3,103 kg/ha, which was 59% higher than the national average productivity of 1,947 kg/ha during the same period.
Medium Productivity Group
A total of 81 districts of various states are falling under medium productivity group. The districts having productivity in the range of 2000-2500 kg/ha are falling under medium productivity group. The average area under rice in medium productivity group covering 81 districts of various states during triennium ending 2001 was 7.77 million ha., which was 17.3% of total area under rice in the country. The average production of 17.45 million tonnes of rice has been recorded from 81 districts of medium productivity group. The production of medium productivity group accounts for 20% of national total average production of rice. The medium productivity group ranks second from production point of view, after high productivity group. Triennium average productivity of medium productivity group covering 81 districts of various states has been worked out to 2,246 kg/ha as against the national average productivity of 1,947 kg/ha. Thus, the average productivity of medium productivity groups was 15% higher than the national average productivity during triennium ending 2001.
Medium-Low Productivity Group
Medium-low productivity group is comprising of 94 districts of various states of the country. The productivity of this group ranges from 1500-2000 kg/ha. Triennium average rice area of 94 districts of medium-low productivity group was 7.54 million hectares, which was 16.8% of national total average area under rice. The average production of 13.38 million tonnes was recorded under medium-low productivity group during triennium ending 2001, which was 15.3% of average national production of rice during the same period. Triennium average productivity of this group has been worked out to 1,775 kg/ha, which was below the average national productivity of rice during the same period.
Low Productivity Group
Maximum number of districts are falling under low productivity group, out of 534 rice growing districts of the country, 155 districts are having low productivity ranging from 1,000-1,500 kg/ha. Triennium average area under rice in 155 districts of low productivity was 11.58 million hectares, which was 25.8% of total area under rice in the country. In fact, area-wise low productivity group ranks second after high productivity group but being the yield per unit area low, total production of this group is less compared to area. Triennium average production of 14.22 million tonnes has been recorded in this group, which was 16.3% of average national production of rice during the same period. Triennium average productivity of this group has been worked out to 1,228 kg/ha, which was much below the average national productivity of rice during the same period.
Very-Low Productivity Group
Very low productivity group comprises of 94 districts of various states and triennium average of area under rice in this group was 5.93 million hectares, which was 13.2% of national average area under rice. Among all productivity group, very low productivity group constitute the lowest area under rice. Similarly, total production of rice in this group is also the lowest. Triennium average production of rice in this group was recorded 4.90 million tonnes, which was 5.6% of national average production of rice in the country. Triennium average productivity of this group has been worked out to 826 kg/ha, which was more than 50% less as compared to the national average productivity of rice during the same period.
Triennium average (1998-2001) of area, production and productivity along with number of districts under different productivity groups are given in Table-1 and state-wise number of districts based on various productivity groups during triennium ending 2001 are given in Table-2. No. of districts under different productivity group and percentage share of area and production are depicted in Pie Diagram No. 1, 2 & 3 respectively.
 |  |
 |
| Triennium Average (1998-1999 to 2000-2001) of Area, Production and Productivity along with number of districts under different productivity groups |
| SL | Productivity Groups | Number of Districts | Area (Million Ha.) | Percent of All India Rice Area | Production in Million Tonnes | Percent of All India Production | Productivity (Kg/Ha.) |
| 1. | High Productivity (> 2,500 Kg/Ha) | 110 | 12.06 | 26.9% | 37.42 | 42.8% | 3,103 |
| 2. | Medium Productivity (> 2,000-2,500 Kg/Ha) | 81 | 7.77 | 17.3% | 17.45 | 20.0% | 2,246 |
| 3. | Medium-Low Productivity (> 1,500-2,000 Kg/Ha) | 94 | 7.54 | 16.8% | 13.38 | 15.3% | 1,775 |
| 4. | Low Productivity (1,000-1,500 Kg/Ha) | 155 | 11.58 | 25.8% | 14.22 | 16.3% | 1,228 |
| 5. | Very-Low Productivity (< 1,000 Kg/Ha) | 94 | 5.93 | 13.2% | 4.90 | 5.6% | 826 |
| TOTAL | 534 | 44.78 | 100.0% | 86.88 | 100.0% | 1,940 |
| SL | State/ Union Territories | Total Rice Growing Districts | High Productivity Districts (> 2,500 Kg/Ha.) | Medium Productivity Districts (2,000- 2,500 Kg/Ha.) | Medium-Low productivity Districts (1,500- 2,000 Kg/Ha.) | Low Productivity Districts (1,000-1,500 Kg/ha.) | Very Low Productivity Districts (< 1,000 Kg/Ha.) |
| 1. | Andhra Pradesh | 22 | 14 | 5 | 2 | 1 | - |
| 2. | Arunachal Pradesh | 13 | - | - | 1 | 6 | 6 |
| 3. | Assam | 23 | - | - | 11 | 11 | 1 |
| 4. | Bihar | 37 | 1 | 4 | 4 | 25 | 3 |
| 5. | Jharkhand | 18 | - | - | 1 | 10 | 7 |
| 6. | Goa | 2 | 2 | - | - | - | - |
| 7. | Gujrat | 14 | 1 | - | 3 | 5 | 5 |
| 8. | Haryana | 18 | 7 | 7 | 2 | 2 | - |
| 9. | Himachal Pradesh | 10 | - | 1 | 2 | 7 | - |
| 10. | Jammu & Kashmir | 12 | 4 | 1 | 5 | 1 | 1 |
| 11. | Karnataka | 27 | 14 | 5 | 6 | 1 | 1 |
| 12. | Kerala | 14 | 3 | 5 | 5 | 1 | - |
| 13. | Madhya Pradesh | 41 | - | 2 | 2 | 6 | 31 |
| 14. | Chhattisgarh | 16 | - | - | 1 | 9 | 6 |
| 15. | Maharashtra | 32 | - | 5 | 1 | 11 | 15 |
| 16. | Manipur | 9 | 4 | - | - | 5 | - |
| 17. | Meghalaya | 7 | - | 1 | 4 | 2 | - |
| 18. | Mizoram | 5 | - | 1 | 3 | 1 | - |
| 19. | Nagaland | 7 | - | - | 2 | 5 | - |
| 20. | Orissa | 30 | - | - | 3 | 17 | 10 |
| 21. | Punjab | 17 | 17 | - | - | - | - |
| 22. | Rajasthan | 18 | - | 1 | 1 | 11 | 5 |
| 23. | Sikkim | 4 | - | - | 1 | 3 | - |
| 24. | Tamil Nadu | 28 | 27 | - | - | 1 | - |
| 25. | Tripura | 4 | - | 2 | 2 | - | - |
| 26. | Uttar Pradesh | 70 | 7 | 29 | 26 | 5 | 3 |
| 27. | Uttranchal | 13 | 1 | 3 | 2 | 7 | - |
| 28. | West Bengal | 18 | 4 | 9 | 3 | 2 | - |
| 29. | A&N Islands | 2 | 1 | - | 1 | - | - |
| 30. | Pondicherry | 3 | 3 | - | - | - | - |
| TOTAL | 534 | 110 | 81 | 94 | 155 | 94 |